Week 9 - Protocols
Protocols: Requests, Standards, and Remote Control
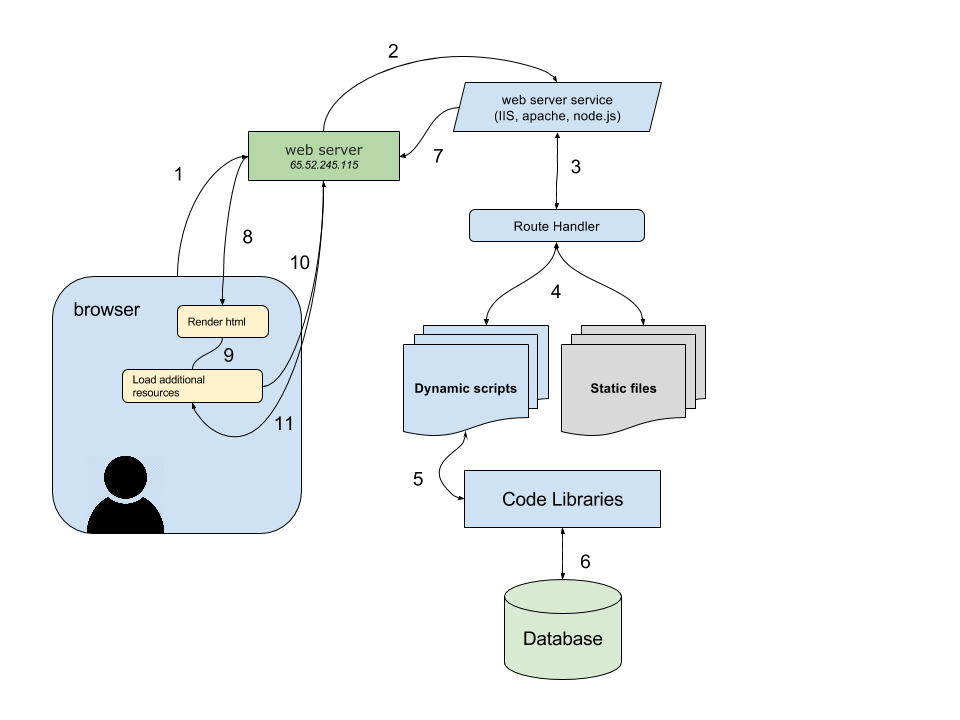
Section titled “Protocols: Requests, Standards, and Remote Control”Last week you commanded. The terminal obeyed. You typed instructions and the system executed them. ls listed files. cd changed directories. Bash scripts automated tasks, transformed text, controlled processes. Your authority was local but absolute. Within your machine’s boundary, you had control. The command line made this explicit: you command, system obeys, hierarchy is clear.
This week, that power shifts. You learn to request rather than command. You want weather data? You must ask a server in Germany. Earthquake information? Petition the USGS API in California. NASA imagery? Submit properly formatted HTTP request to servers in Virginia and wait for response. The resources exist, but we have no direct access to these resources, no authority over these systems, only the ability to negotiate through protocols. The shift from imperative to interrogative is not merely grammatical.
Alexander Galloway’s Protocol: How Control Exists After Decentralization (2004) addresses this paradox. The internet appears decentralised. No single point of control. Distributed architecture. Peer-to-peer mythology. Anyone can publish. Information wants to be free. The narrative of digital liberation promised horizontal networks replacing vertical hierarchies, democratisation replacing gatekeeping, access replacing exclusion. Yet control persists. It has not disappeared but reorganised.
Galloway argues that protocols are the new power structures. Not centralised authority issuing commands from above, but technical standards determining how nodes communicate, what formats data takes, which interactions are possible. Protocol is, in his words, “a language that regulates flow, directs netspace, codes relationships, and connects life-forms.” It appears merely technical, neutral, concerned only with interoperability and efficiency. But protocols encode politics. They determine who can speak, in what format, through which channels, under what conditions. They standardise; and standardisation is never neutral. It advantages those whose needs align with the standard whilst marginalising those whose needs do not fit.
Consider TCP/IP, the fundamental protocol suite underlying the internet. It specifies how data packets are formatted, addressed, transmitted, routed, received. Every device communicating over networks must speak TCP/IP. This universality enables interoperability but also enforces conformity. Devices that cannot speak TCP/IP correctly are excluded from the network. The protocol does not care why you cannot comply, whether due to technical limitation, economic constraint, or political resistance. Either you speak the language or you are refused entry. This is control through architecture rather than authority.
 From WikiMedia
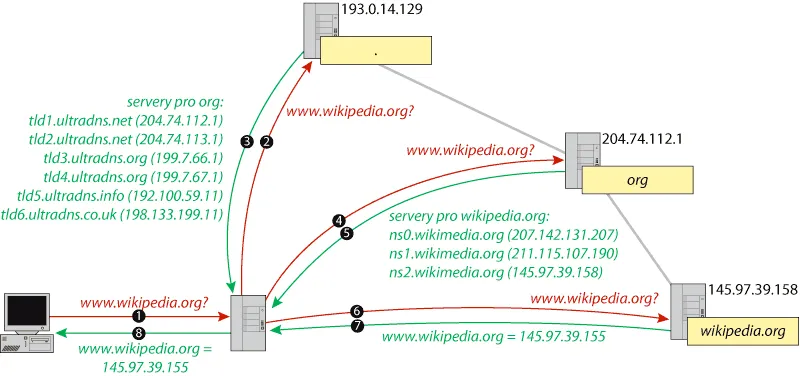
Or consider DNS, the Domain Name System that translates human-readable URLs into machine-readable IP addresses. When you type example.com, your request travels through hierarchical system of nameservers until it resolves to numeric address. ICANN controls top-level domains (.com, .org, .net). National governments control country codes (.uk, .cn, .ru). Corporations and individuals control subdomains. This distribution appears democratic until you ask: who decided on this hierarchy? What happens when domain registrar refuses service for political reasons? What happens when governments seize domains? Protocol determines visibility. If DNS will not resolve your name, you effectively do not exist on the network. You can maintain server, you can have content, but without entry in the naming system, you are unreachable. Control without centralisation.
 From WikiMedia
Galloway distinguishes between protocols that enable and protocols that constrain. Some protocols are permissive, allowing many implementations, flexible in interpretation. Others are restrictive, demanding exact compliance, intolerant of variation. But all protocols constrain possibility space. They define valid versus invalid, compliant versus non-compliant, included versus excluded. This definitional power is political power. Who sits on standards committees deciding HTTP evolution? Whose use cases shape REST API conventions? Which languages get Unicode support first? Standards embed particular worldviews, economic interests, cultural assumptions. They appear objective but reflect values of their designers.
Week 8’s command line made visible power relations that graphical interfaces hide. We saw files as they actually exist, processes as they actually run, permissions as they actually restrict. This week, protocols make visible power relations that local computing obscures. When you write let x = 5, the assignment is immediate, local, under your control. The variable exists in your program’s memory. You created it. You control it. When you write loadJSON(url), you initiate negotiation with distant system that might refuse, might fail, might surveil your request, might charge you for access, might disappear tomorrow. You have built dependency you do not control.
This is the shift: from sovereignty to supplication, from command to request, from local authority to networked negotiation. Your sketch’s functionality now depends on infrastructure maintained by others, following protocols you did not design, serving interests you may not share. You must speak languages protocols require. You must format requests correctly. You must wait for responses. You must handle refusal gracefully. You cannot command the network. You can only ask politely and hope it answers.
The technical work this week involves learning how to make these requests using p5.js. We will use loadJSON() to fetch data from APIs. We will parse JSON responses. We will handle errors when networks fail. We will visualise remote data. But the critical work involves understanding what it means to depend on distant systems, to negotiate through protocols, to build creative work whose existence requires cooperation from infrastructure you do not own, maintain, or control.
Nicole Starosielski’s The Undersea Network (2015) demonstrates this materially. The internet’s physical infrastructure follows colonial-era shipping routes. Undersea cables connecting continents were laid along pathways established by empire. Contemporary network geography inherits imperial infrastructure. Data flowing between London and Mumbai travels cables following routes British Empire established for extracting resources from colonised territories. The network is not placeless. It has geography, history, politics. When you request data from an API, our request traverses this infrastructure, carrying with it histories of extraction, exploitation, control.
This week I want us to think about networks not as abstract space but as material infrastructure with geography, history, politics. To think about protocols not as neutral standards but as power relations encoded in technical specifications. To think about APIs not as convenient services but as dependencies that constrain your work’s autonomy. The code you write this week will fetch data from distant servers. Each request executes protocol. Each response depends on cooperation. Each dependency shapes what becomes possible.
The theoretical framing Galloway provides reveals that decentralisation does not eliminate control but distributes it differently. Instead of central authority commanding from above, protocols regulate from within. They are immanent rather than transcendent, embedded rather than imposed, technical rather than political in appearance. But they govern nonetheless. They determine what can be said, in what format, through which channels. They are the operating system of network age. Understanding protocol means understanding contemporary power.
What does this mean for creative coding? It means that when you build network-based work, you are not just using convenient tools. You are entering into political relations. You are depending on infrastructure shaped by history. You are speaking languages designed by others. You are negotiating with systems that may refuse you. This does not mean you should not use networks. It means you should understand what you are doing when you do. It means your code should make visible the dependencies it creates, the protocols it executes, the power relations it participates in.
Part 1: From Commanding to Requesting
Section titled “Part 1: From Commanding to Requesting”Working Locally with Network Requests & Asynchrony
Section titled “Working Locally with Network Requests & Asynchrony”Week 4 introduced abstraction through functions. random() hides pseudorandom algorithms. rect() hides vertex calculations. We use without understanding implementation. Abstraction chooses what to expose and what to hide, what to make easy and what to make difficult. This is never neutral.
p5.js extends abstraction to network requests. Internally, loadJSON() uses JavaScript’s fetch() API, which returns Promises requiring async/await handling. But we never see this. p5.js black-boxes asynchrony behind preload():
let weatherData;
function preload() { weatherData = loadJSON('https://api.open-meteo.com/v1/forecast?latitude=51.5074&longitude=-0.1278¤t=temperature_2m');}
function setup() { createCanvas(400, 400); console.log(weatherData);}
function draw() { background(220); // all the data on this API is located at weatherData.current.temperature_2m // how do I know? API documentation https://open-meteo.com/en/docs let temp = weatherData.current.temperature_2m;
fill(map(temp, -10, 30, 0, 255), 100, 200); circle(200, 200, temp * 10);
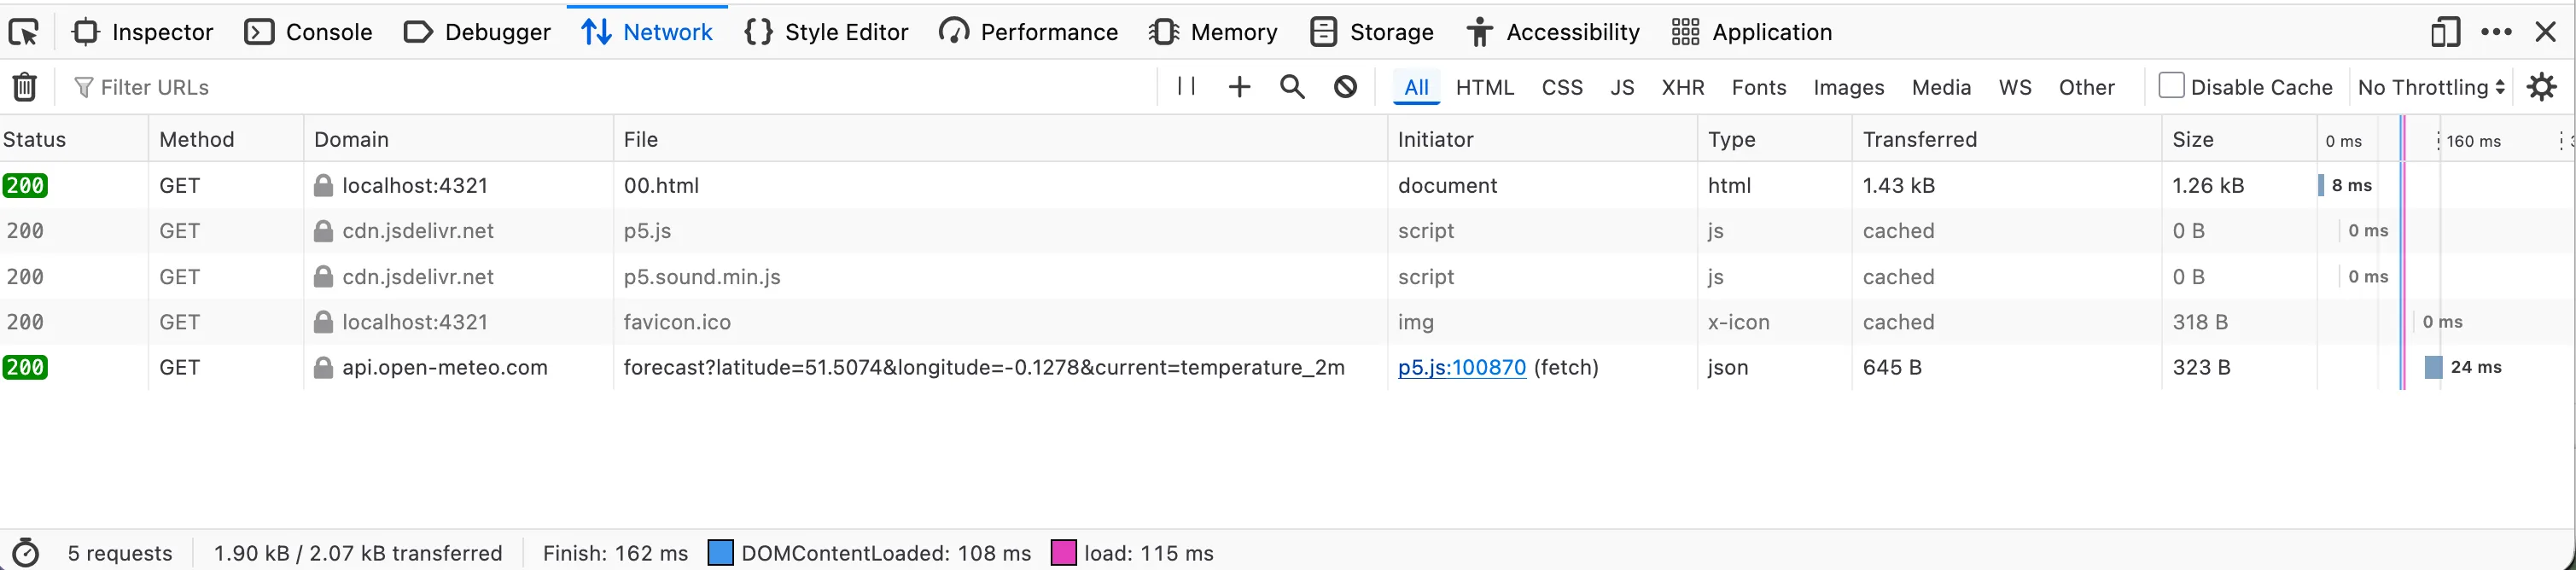
fill(0); textAlign(LEFT); textSize(14); text('temperature: ' + temp + '°C', 20, 30); text('current time: ' + weatherData.current.time, 20, 50); text('latitude: ' + weatherData.latitude, 20, 70); text('longitude: ' + weatherData.longitude, 20, 90); text('timezone: ' + weatherData.timezone, 20, 110);}Save this in week-9-protocol/sketch.js. When we run it with Live Server, open the browser’s Developer Tools (F12) to see console messages and any network errors. The Network tab shows the actual HTTP request being made, response time, headers sent and received. This visibility matters. In the p5.js web editor, these details are hidden. Working locally, we see the negotiation happening.
What happens here? The preload() function tells p5.js: load this resource before setup() runs. p5.js displays “Loading…” automatically, waits for all preload operations to complete, handles promises invisibly. By time setup() runs, weatherData exists. We write synchronous-looking code. The network request, the waiting, the parsing, all abstracted away.
This makes networks feel similar to local files. Loading remote JSON feels identical to loading local JSON. Same function. Similar syntax. But these are politically different acts. Local JSON uses filesystem we control. Remote JSON traverses undersea cables following colonial shipping routes, passes through data centres grafted onto Cold War military installations, gets logged by servers that profile our interests, costs bandwidth and electricity, requires network infrastructure we did not build and cannot maintain. The abstraction makes them equivalent, hiding material and political difference.
Notice what p5.js chooses to hide and what to expose. It hides timing (preload waits automatically) but exposes data structure (we must understand JSON). It hides HTTP status codes (404, 500 errors fail silently unless we add error callback) but exposes CORS restrictions (requests to non-CORS-enabled APIs fail with console messages about “blocked by CORS policy”). These choices shape what feels easy versus hard, what appears simple versus complex, what we notice versus ignore.
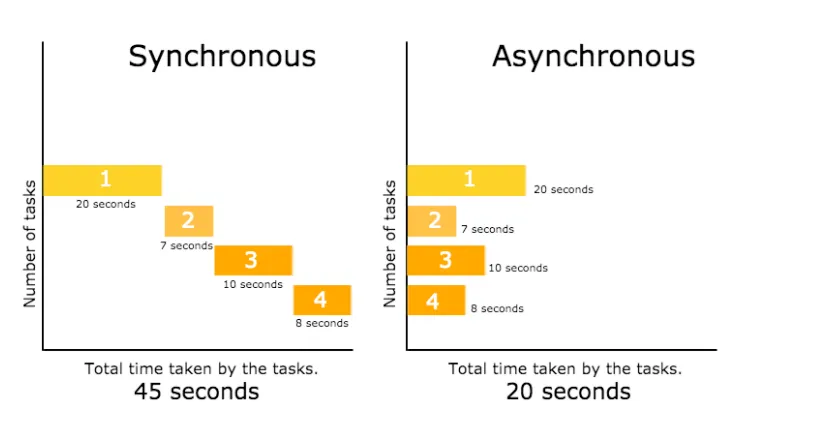 From Synchronous vs. Asynchronous JavaScript
The abstraction is useful. Beginners can use APIs without understanding asynchrony, promises, error handling. But abstraction assumes cooperation, standard compliance, servers behaving predictably. When assumptions break, so does code. When server returns HTML error page instead of JSON, loadJSON() fails to parse. When API changes its data structure, our sketch breaks. When network is unavailable, our sketch displays nothing. The abstraction hides dependency whilst creating it.
The Client-Server Relation
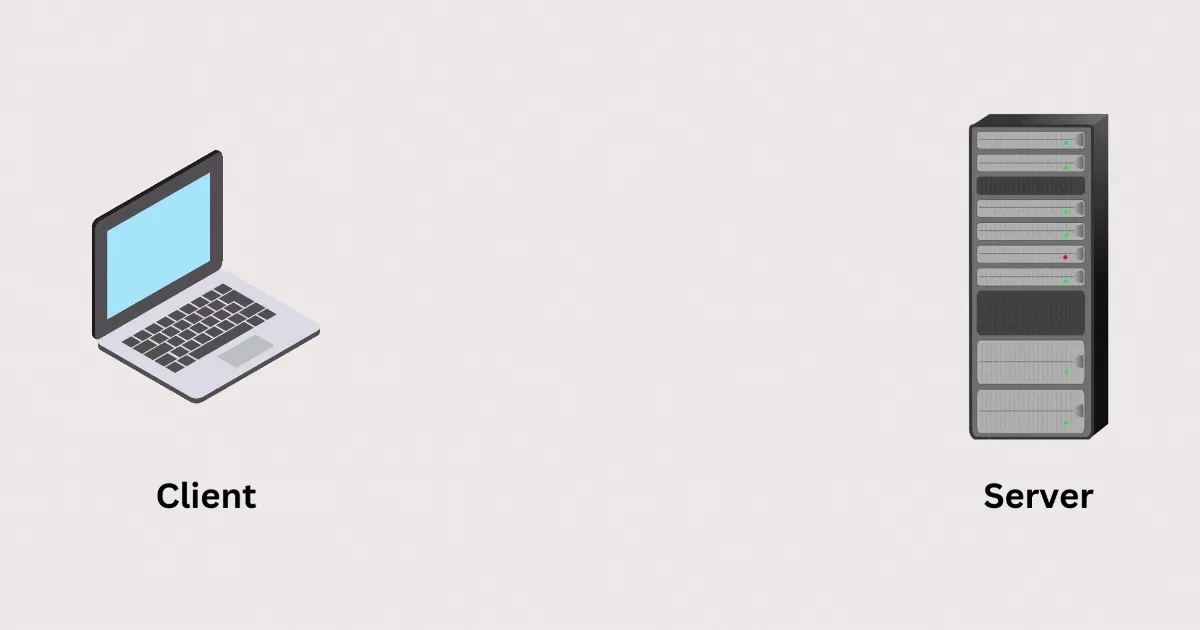
Section titled “The Client-Server Relation”What we are writing is client-side code. Our p5.js sketch is client. The API we request from is server. This is not symmetrical relation. Clients request. Servers decide whether to respond. Power lies with those who hold data, not those who desire it.
HTTP codifies this into protocol. Methods include GET (retrieve), POST (submit), PUT (update), DELETE (remove). But who can GET what? Who has permission to POST? The server decides. HTTP status codes position us as supplicant: 200 OK, 401 Unauthorized, 403 Forbidden, 404 Not Found, 500 Internal Server Error. We request. Server judges. Server responds. Server determines our access.

REST (Representational State Transfer) extends this into architectural style. Resources have URLs. Clients request resources. Servers send representations. Each request is stateless, meaning server remembers nothing about previous requests. We must identify ourselves every time. This statelessness prevents relationship. We cannot build history with server, cannot establish trust, cannot negotiate based on past interactions. Every request starts from zero. This benefits servers (simpler to implement, easier to scale) whilst disadvantaging clients (must repeatedly prove legitimacy, must resend context, must accept cookies or whatever terms server currently offers).
 From Understanding the Basics of Network Protocols
When we write loadJSON('https://api.example.com/data'), we initiate this negotiation. Our sketch sends HTTP GET request. The request travels through our router, our ISP’s infrastructure, multiple backbone networks, possibly undersea cables, eventually reaching server. Server receives request, checks if URL exists, checks if we have permission, generates response, sends back. Response travels same route in reverse. This takes time. Milliseconds if server is nearby and network is fast. Seconds if server is distant or network is congested.
Our code must account for this temporality. We cannot write let data = loadJSON(url); console.log(data); because data does not exist yet. The request has been initiated but not completed. This is why p5.js requires preload() or callbacks. The abstraction handles timing so we do not have to write async/await, but timing still matters. Our sketch depends on distant machine responding, which depends on network functioning, which depends on infrastructure we do not control.
 From
From 
Our First Request: Weather Data
Section titled “Our First Request: Weather Data”Let us request something and examine what it means. Open-Meteo provides weather data with no authentication required, CORS enabled, free for reasonable use:
let weatherData;
function preload() { weatherData = loadJSON('https://api.open-meteo.com/v1/forecast?latitude=51.5074&longitude=-0.1278&hourly=temperature_2m,wind_speed_10m&forecast_days=1');}
function setup() { createCanvas(400, 400); noLoop();}
function draw() { background(20); translate(width/2, height/2);
let temps = weatherData.hourly.temperature_2m; let winds = weatherData.hourly.wind_speed_10m;
// each hour is a segment radiating from center for (let i = 0; i < temps.length; i++) { let angle = map(i, 0, temps.length, 0, TWO_PI); let temp = temps[i]; let wind = winds[i];
// temp controls distance let distance = map(temp, -10, 35, 50, 300);
// and wind controls line weight let weight = map(wind, 0, 50, 1, 32);
push(); rotate(angle);
// drawing line from center outward strokeWeight(weight); stroke(map(temp, -10, 50, 200, 0), 100, 255); // arbitrary -10-50 temp range line(0, 0, distance, 0);
// temp rings noStroke(); fill(map(temp, -10, 50, 255, 0), 100, 255, 150); circle(distance, 0, weight * 3);
pop(); }
// Center point fill(255); noStroke(); circle(0, 0, 10);
textAlign(CENTER); textSize(12); text('24hr London', 0, -20);}This code makes one HTTP GET request to Open-Meteo’s API. We specify latitude, longitude, and which current weather parameters we want. The API responds with JSON containing temperature and wind speed measurements from weather stations near those coordinates. Our sketch parses JSON, extracts numeric values, maps them to visual properties.
What actually happened? Our request travelled through network infrastructure to Open-Meteo’s servers, which queried databases aggregating measurements from meteorological services, formatted results as JSON, sent response back. Someone maintains those servers. Someone pays hosting costs. Someone wrote the API. Someone moderates access. “Free” APIs are never truly free. Either they are passion projects (likely to disappear when maintainer loses interest), or they are loss leaders for paid tiers (this free tier will become restricted), or they are surveillance instruments (logging who requests what to build profiles), or they are publicly funded (taxpayers bear cost).
Open-Meteo is relatively ethical. Open-source, transparent about data sources, funded by donations. But most APIs are not. They are corporate infrastructure extracting value. Google Maps API was free for years, building dependency across millions of applications. Then Google started charging. Applications broke. Developers scrambled. Google had successfully enclosed what was public (geographic data from OpenStreetMap and government sources) through protocol (their API became standard). This is enclosure through standardisation. Make protocol dominant, then exploit dependence.
When we make our sketch dependent on API, we participate in this. Our work’s continued existence depends on someone else maintaining service, following protocol we did not design, serving interests we may not share. This does not mean we should not use APIs. It means understand the relation. We are client, not partner. We request, not command. We are granted access, not guaranteed it.
Multiple Requests: Comparing Cities
Section titled “Multiple Requests: Comparing Cities”We can request data from multiple locations and compare:
let londonWeather;let bengaluruWeather;let taipeiWeather;
function preload() { londonWeather = loadJSON('https://api.open-meteo.com/v1/forecast?latitude=51.5074&longitude=-0.1278¤t=temperature_2m'); bengaluruWeather = loadJSON('https://api.open-meteo.com/v1/forecast?latitude=12.9716&longitude=77.5946¤t=temperature_2m'); taipeiWeather = loadJSON('https://api.open-meteo.com/v1/forecast?latitude=25.0330&longitude=121.5654¤t=temperature_2m');}
function setup() { createCanvas(600, 600); noLoop();}
function draw() { background(240);
let londonTemp = londonWeather.current.temperature_2m; let bengaluruTemp = bengaluruWeather.current.temperature_2m; let taipeiTemp = taipeiWeather.current.temperature_2m;
// London - horizontal strokes let londonDensity = map(londonTemp, -10, 35, 50, 300); for (let i = 0; i < londonDensity; i++) { stroke(180, 50, 60, random(30, 150)); strokeWeight(random(1, 8)); let y = random(height); line(0, y, random(width * 0.3, width), y); }
// Bengaluru - vertical strokes let bengaluruDensity = map(bengaluruTemp, -10, 35, 50, 300); for (let i = 0; i < bengaluruDensity; i++) { stroke(80, 120, 90, random(30, 150)); strokeWeight(random(1, 8)); let x = random(width); line(x, 0, x, random(height * 0.3, height)); }
// Taipei - diagonal strokes let taipeiDensity = map(taipeiTemp, -10, 35, 50, 300); for (let i = 0; i < taipeiDensity; i++) { stroke(70, 100, 140, random(30, 150)); strokeWeight(random(1, 8)); let x1 = random(width); let y1 = random(height); let len = random(50, 200); line(x1, y1, x1 + len, y1 + len); }
// Data with colored backgrounds textSize(14); textAlign(LEFT);
fill(180, 50, 60); rect(10, 10, 180, 25); fill(255); text('London: ' + londonTemp + '°C', 15, 28);
fill(80, 120, 90); rect(10, 40, 180, 25); fill(255); text('Bengaluru: ' + bengaluruTemp + '°C', 15, 58);
fill(70, 100, 140); rect(10, 70, 180, 25); fill(255); text('Taipei: ' + taipeiTemp + '°C', 15, 88);}This demonstrates multiple simultaneous requests. preload() waits for all three to complete before setup() runs. Each city’s temperature drives colour, pattern and direction. Data for all three cities are still being served by the same API. Perhaps the same server too. But what if we are to work with systems where we fetch data from different APIs, at different servers, maintained by different organisations, with different priorities? This multiplicity reveals dependency more clearly than single request. If one API fails, one city disappears. If all three are slow, our sketch hangs during preload. We have built work that requires three separate infrastructures cooperating simultaneously.
When Protocols Cannot Accommodate
Section titled “When Protocols Cannot Accommodate”American Artist’s work “I’m Blue (If I Was █████ I Would Die)” (2018-2019) paired screenshots of Doctor Manhattan from Watchmen with excerpts from Christopher Dorner’s manifesto. Dorner, ex-LAPD officer and Black man, wrote manifesto explaining why he would target police after being fired for reporting excessive force. His face circulated through surveillance networks, police databases, wanted posters. Black face marked for tracking, tagged in facial recognition systems, flagged in algorithmic risk assessments. American Artist asks: what protocols render Black bodies hypervisible to police systems whilst invisible to recognition as human? Surveillance is protocol. It determines who gets tracked, in what databases, tagged with which labels, marked as what kind of threat.
“Black Gooey Universe” (2018-2021) examines early computer interfaces. Before graphical user interfaces, screens were black. Computation happened in darkness, with phosphor illuminating text and graphics against black void. Black was default state, foundation upon which everything else appeared. American Artist argues blackness is foundational to computing, not incidental. The series includes “My Blue Window” (2019-2020, Queens Museum), installation of blue-screened computers exploring how “blue screen of death” references both system failure and police violence.
 From artist’s website
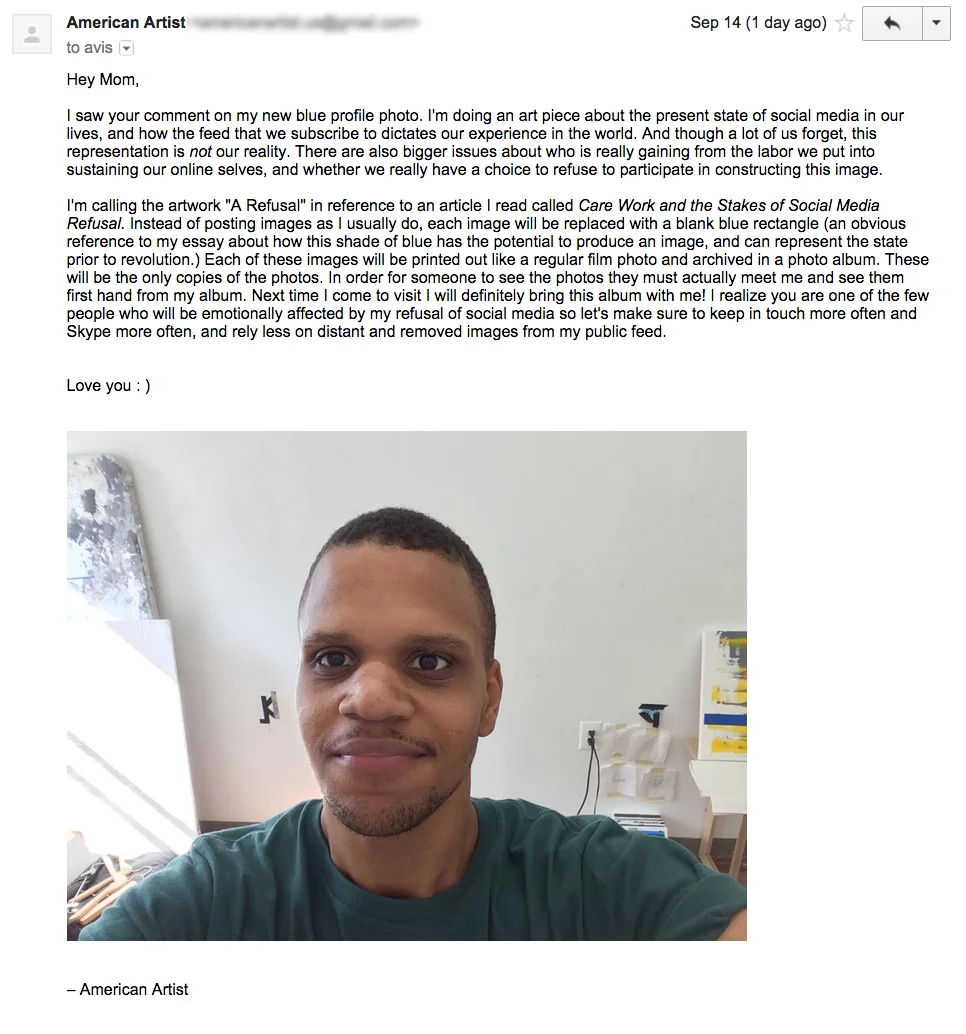
“A Refusal” (2015-2016) deleted all Facebook photos, replacing them with blue squares. This refuses data extraction. Facebook’s protocol assumes users provide images for facial recognition training, advertising targeting, social graph construction. The API expects photos with faces, metadata with locations, tags with identities. Replacing images with uniform blue subverts this. We remain on platform (complying technically) whilst providing useless data (violating protocol’s intent). Refusal is networked tactic. We speak the protocol but say nothing. We fill required fields with information that breaks the system’s ability to extract value from us.
 From artist’s website
What does this teach about networks? Protocols assume compliance. They assume we want to play by rules. When we refuse, when we exploit ambiguities, when we provide technically valid but semantically empty data, the protocol fails. Not because of bug. Because protocols cannot handle resistance they did not anticipate. They cannot accommodate users who understand the system well enough to subvert it.
Example
Section titled “Example”let musicData;
let artistName = "Led Zeppelin" // change it do a different name and see how the data is different
function preload() { musicData = loadJSON(`https://itunes.apple.com/search?term=${artistName}&entity=song&limit=50`); // string literals to use variable name inside a string}
function setup() { createCanvas(600, 600); background(10);}
function draw() { background(10, 5);
let songs = musicData.results;
translate(width/2, height/2);
// Each song's duration becomes a rotating line // longer songs = longer lines
for (let i = 0; i < songs.length; i++) { let duration = songs[i].trackTimeMillis / 1000; // seconds let trackNum = songs[i].trackNumber || 1;
push(); rotate(frameCount * 0.001 * trackNum);
// Duration controls line length let len = map(duration, 0, 600, 20, 250);
// track number controls color stroke(map(trackNum, 0, 20, 150, 255), 100, 200, 100); strokeWeight(2); line(0, 0, len, 0);
noStroke(); fill(255, 200); circle(len, 0, 4);
pop(); }
fill(255); noStroke(); circle(0, 0, 10);
// info box textAlign(LEFT); textSize(11); fill(255); text(songs.length + ` ${artistName} songs`, -width/2 + 10, -height/2 + 20); text('duration = length | track number = rotation speed', -width/2 + 10, height/2 - 10);}Part 2: Speaking the Language Protocols Require
Section titled “Part 2: Speaking the Language Protocols Require”Working with JSON Locally
Section titled “Working with JSON Locally”We are working in VSCodium, testing with Live Server. Our folder structure should be: week-9-protocol/ containing index.html, sketch.js, and any other files we create. When we fetch JSON from APIs, the data appears in our browser’s console (open Developer Tools with F12). The Console tab shows parsed data. The Network tab shows the raw HTTP request and response. This visibility is crucial for understanding what protocols actually do versus what abstractions hide.
JSON as Hierarchical Structure
Section titled “JSON as Hierarchical Structure”When APIs respond, they send JSON. JavaScript Object Notation is text-based format that looks like JavaScript objects but is stricter. Rules: keys must be double-quoted, no trailing commas, no undefined (use null instead), strings in double quotes only. The Open-Meteo API returns JSON like this:
{ "latitude": 51.5, "longitude": -0.12, "current": { "time": "2025-11-26T14:00", "temperature_2m": 8.5, "wind_speed_10m": 12.3 }}We access nested data with dot notation: weatherData.current.temperature_2m gives us the temperature. If JSON contains arrays, use bracket notation: earthquakeData.features[0].properties.mag gets magnitude of first earthquake. Understanding JSON structure is crucial because we must navigate it to extract useful data.
But JSON is not neutral format. It embodies particular assumptions. Hierarchical structure assumes data organises as objects containing objects, trees with roots and branches. This suits some knowledge but not all. Western naming conventions (camelCase, snake_case) are baked in. Numeric precision has limits (JavaScript’s 64-bit floats). No native date format exists; dates are strings we must parse, and parsing assumes Gregorian calendar, Western time zones, particular epoch (1970-01-01T00:00:00Z).
What cannot be represented in JSON? Circular references (object A references object B which references object A). Functions or executable code (JSON is data, not logic). Binary data (must be Base64-encoded as strings). Temporal relations outside timestamps (seasonal cycles, ritual calendars, non-linear time). Kinship networks where relationships are non-hierarchical reciprocal obligations rather than parent-child trees. Indigenous ontologies where beings exist in networks of relation rather than as discrete autonomous entities.
JSON’s hierarchical structure reflects particular worldview. Data has types (string, number, boolean, null, array, object). Objects have properties. Arrays have ordered elements. This is object-oriented metaphysics: reality consists of distinct entities with attributes. Many traditions understand reality differently. Not as things with properties but as processes, relations, flows, becomings. JSON cannot encode this. The protocol determines what can be thought.
Parsing Nested JSON: Earthquake Data
Section titled “Parsing Nested JSON: Earthquake Data”Working with JSON means navigating nested structures. Let us fetch earthquake data and extract specific information:
let earthquakes;
function preload() { earthquakes = loadJSON('https://earthquake.usgs.gov/earthquakes/feed/v1.0/summary/4.5_week.geojson');}
function setup() { createCanvas(800, 600); noLoop();}
function draw() { background(250);
// GeoJSON structure has features array let quakes = earthquakes.features;
// Filter for significant magnitudes let significant = quakes.filter(q => q.properties.mag >= 5.0);
fill(0); textSize(16); text('Earthquakes M≥5.0 this week: ' + significant.length, 20, 30);
// Sort by magnitude, largest first significant.sort((a, b) => b.properties.mag - a.properties.mag);
// Display top 10 for (let i = 0; i < min(10, significant.length); i++) { let quake = significant[i]; let magnitude = quake.properties.mag; let place = quake.properties.place; let timestamp = new Date(quake.properties.time);
let y = 70 + i * 50;
// Magnitude as circle fill(map(magnitude, 5, 8, 100, 255), 50, 50); circle(40, y, magnitude * 8);
// Details fill(0); textSize(14); text('M' + magnitude.toFixed(1), 80, y - 10); textSize(12); fill(100); text(place, 80, y + 8); text(timestamp.toLocaleString(), 80, y + 24); }
// Metadata about data fill(150); textSize(11); let updateTime = new Date(earthquakes.metadata.generated); text('Data generated: ' + updateTime.toLocaleString(), 20, height - 20); text('This data reflects USGS collection infrastructure, not all seismic activity', 20, height - 5);}This code demonstrates several operations. First, accessing nested structure: earthquakes.features gets array, then q.properties.mag gets magnitude from each feature. Second, filtering: JavaScript’s array.filter() creates new array containing only elements matching condition. Third, sorting: array.sort() reorders elements based on comparison function. Fourth, limiting display with min() to avoid overwhelming screen.
But notice what the code does not question. It treats USGS data as complete record of seismic activity. It is not. USGS monitors earthquakes in areas with sensors. Many earthquakes occur in unmonitored regions, particularly in Global South, particularly in colonised territories where infrastructure investment is minimal. The JSON we receive reflects what gets measured, which reflects where measuring infrastructure exists, which reflects whose safety matters enough to warrant investment. The data is not neutral snapshot of geological reality. It is product of infrastructural politics.
What Datasets Are Missing
Section titled “What Datasets Are Missing”Mimi Ọnụọha coined term “algorithmic violence” to describe how probabilistic systems aggravate structural vulnerability. Her work examines what protocols make uncomputable.
“The Library of Missing Datasets” (2016, 2018, 2022) physically instantiates absence. Filing cabinets contain empty folders labelled with datasets that should exist but do not: “Civilians killed in encounters with police or law enforcement agencies”, “People excluded from public housing because of criminal records”, “Trans people killed or injured in instances of hate crime”, “Poverty and employment data for Indigenous populations”.
This is protocol critique. If protocols determine what becomes data (standardised formats, required fields, collection methods), then missing datasets reveal whose lives protocols deem unmeasurable. Police killings lack comprehensive national database because no standardised reporting protocol exists. Each jurisdiction collects (or does not collect) according to local procedures. No federal mandate requires reporting. Result: systematically unmeasured violence. When data does not exist, analysis cannot happen. When analysis cannot happen, policy cannot change. Absence of protocol is political choice maintaining status quo.
Tech companies collect vast data on user behaviour whilst keeping proprietary. Facebook knows our social graph, our interests, our movements, our relationships. This data exists but remains inaccessible. Protocol protects corporate interest whilst obscuring public harm. APIs provide limited access to sanitised subsets. Full data remains locked. Missing not because uncollected but because withheld.
“The Cloth in the Cable” (2022) wraps undersea internet cables with hair, cloth, dust, spices, herbs from Igbo heritage. This materially intervenes in infrastructure mythology. Cables are not neutral conduits but can carry alternative ontologies. Starosielski traces how undersea cables follow colonial shipping routes. Ọnụọha proposes infusing these cables with knowledge systems colonialism suppressed. The work asks: what if network protocols encoded non-Western epistemologies? If cables transmitted alongside data streams the genealogies, cosmologies, plant knowledges that imperial infrastructure aimed to erase?
 Image from artist’s website
“These Networks In Our Skin” (2021) video shows four women (hands only) deconstructing cables, interweaving technological components with organic materials. They fuse wires with herbs, wrap circuits with cloth, embed computation in living matter. This proposes protocol otherwise: not data divorced from body but data as embodied practice, not network as abstract graph but network as skin, breathing, connected to earth.
Google Sheets as DIY Data Infrastructure
Section titled “Google Sheets as DIY Data Infrastructure”If protocols determine what becomes data, creating our own datasets is intervention. Most APIs are corporate infrastructure. We request data from organisations with servers, budgets, engineering teams. But we can create our own data, structure it ourselves, make it accessible through protocol.
Spreadsheets are databases for people who do not identify as database administrators. Google Sheets is infrastructure posing as convenience. We think we are making a list. We are actually operating distributed database with complex querying, collaboration protocols, access controls, version history. opensheet.elk.sh is service that exposes Google Sheets as JSON APIs, turning our spreadsheet into data endpoint anyone can request from.
This is not liberation or merely infrastructural resistance. We still fully depend on Google, still subject to their terms, still surveilled through their logging. But it redistributes some control. We decide what data exists. We structure it. We determine access. We can create datasets that should exist but do not, responding directly to Ọnụọha’s missing datasets critique.
How It Works:
-
Create Google Sheet with data. First row is headers (column names). Each subsequent row is data entry.
-
Share sheet publicly: File → Share → “Anyone with link can view” (set to Viewer, not Editor)
-
Copy the sheet ID from URL. Google Sheets URLs look like:
https://docs.google.com/spreadsheets/d/SHEET_ID_HERE/edit. Copy the long string between/d/and/edit. -
Request data:
https://opensheet.elk.sh/SHEET_ID/SHEET_NAME- Replace
SHEET_IDwith copied ID - Replace
SHEET_NAMEwith name of the tab (bottom of spreadsheet, defaults to “Sheet1”)
- Replace
Example: Personal Observations
Create Google Sheet called “Week 9 Observations”. Name the tab “daily”. Structure it like this:
| date | time | location | mood | notes |
|---|---|---|---|---|
| 2025-11-24 | 09:00 | Home | calm | yet another gray day |
| 2025-11-24 | 14:30 | Library | confused | why are there no books? |
| 2025-11-25 | 08:15 | Tube | tired | no delays today |
| 2025-11-25 | 19:00 | Studio | still tired | Ideas flowing |
When we request this via opensheet, it returns JSON array of objects:
[ { "date": "2025-11-24", "time": "09:00", "location": "Home", "mood": "calm", "notes": "yet another gray day" }, { "date": "2025-11-24", "time": "14:30", "location": "Library", "mood": "confused", "notes": "why are there no books?" }, ...]Each row becomes object. Column headers become keys. Cell values become values (as strings). Overall an array of objects.
Using in p5.js:
let observations;
function preload() { // Replace SHEET_ID with actual ID let url = 'https://opensheet.elk.sh/YOUR_SHEET_ID_HERE/SHEET_NAME'; observations = loadJSON(url);}
function setup() { createCanvas(800, 600); noLoop();}
function draw() { background(250);
fill(0); textSize(16); text('Personal Observations', 20, 30); textSize(11); fill(100); text('Data collected over one week, structured by me, accessible via my own API', 20, 48);
// Display each observation for (let i = 0; i < observations.length; i++) { let obs = observations[i]; let y = 90 + i * 90;
// Mood determines colour let moodColour; if (obs.mood === 'calm') moodColour = color(100, 150, 200); else if (obs.mood === 'confused') moodColour = color(100, 200, 150); else if (obs.mood === 'tired') moodColour = color(150, 150, 150); else moodColour = color(200);
// Visual bar fill(moodColour); rect(20, y - 10, 8, 70);
// Text details fill(0); textSize(13); text(obs.date + ' ' + obs.time, 40, y); textSize(12); fill(100); text(obs.location + ' • ' + obs.mood, 40, y + 18); fill(80); textSize(11); text(obs.observation, 40, y + 38, width - 60); }
fill(150); textSize(10); text('This data measures what I chose to notice. What did measuring change about noticing?', 20, height - 10);}Save this in week-9-protocol-opensheet/sketch.js. Test with Live Server. Open Developer Tools Network tab to watch the request to opensheet, which then requests our Google Sheet, parses it to JSON, returns it to our sketch.
What This Enables:
We can create datasets that do not exist. Track things APIs ignore: our own observations, feelings, encounters. Things corporations do not monetise. Local measurements. Community-specific data. Anything we care about that platforms deem unmeasurable. opensheet.elk.sh gives us infrastructure to make our data accessible programmatically whilst maintaining some control over structure and content.
But notice the dependencies: Google can delete our sheet, change access rules, shut down Sheets entirely. opensheet.elk.sh is maintained by one person (Ben Borgers); if they stop maintaining it, the service disappears. Our “independent” data depends on corporate infrastructure and volunteer labour. The protocol (HTTP + JSON) remains standard, but the infrastructure enabling it is precarious.
Critical Questions:
When we use Google Sheets as database, whose infrastructure are we using? Google’s servers, Google’s surveillance, Google’s terms of service. We are not hosting our own data. We are storing it on their systems, subject to their scanning, their data retention, their compliance with government requests. The convenience is not neutral. We trade autonomy for ease.
What does it mean that spreadsheets are universal? Excel and Google Sheets dominate because they make databases accessible to non-programmers. But spreadsheet logic (rows, columns, cells, formulas) structures thinking. It makes hierarchical data natural, relational data awkward, non-tabular data impossible. When we put observations into spreadsheet, we force them into grid. What resists gridding? What cannot be captured in cells?
REST as Architectural Convention
Section titled “REST as Architectural Convention”REST (Representational State Transfer) is architectural style most public APIs follow. Key principles make it predictable but also constrain possibility.
Resources have URLs: Everything accessible via unique address. /users/123 gets user with ID 123. /posts/456/comments gets comments on post 456. This URL structure mirrors filesystem paths, inheriting hierarchical assumptions. Resources nest like directories. But not all things nest hierarchically. Networks of relation resist tree structures.
Standard HTTP methods: GET retrieves (read-only, no side effects). POST creates new resource. PUT updates existing resource. DELETE removes resource. This CRUD (Create, Read, Update, Delete) paradigm assumes data lifecycle is creation followed by modification followed by deletion. But many processes are not linear. Some data emerges gradually, exists temporarily, transforms continuously. REST’s verbs assume particular temporality.
Stateless requests: Each request must contain all information needed to process it. Server remembers nothing about previous requests. This means clients must repeatedly identify themselves, resend context, accept whatever terms server currently offers. Statelessness benefits servers (simpler to implement, easier to scale) but disadvantages clients (cannot build relationship, cannot negotiate based on history, must start from zero each time).
JSONPlaceholder demonstrates REST conventions:
let pokemonList = null;let selectedPokemon = null;
function preload() { pokemonList = loadJSON('https://pokeapi.co/api/v2/pokemon?limit=10');}
function setup() { createCanvas(600, 500);}
function draw() { background(240);
if (!pokemonList) return;
// Show pokemon list fill(0); textSize(14); text('Pokemon (click to see details)', 20, 30);
let results = pokemonList.results; for (let i = 0; i < results.length; i++) { let pokemon = results[i]; let y = 60 + i * 35;
// Highlight if clicked if (selectedPokemon && selectedPokemon.name === pokemon.name) { fill(255, 220, 220); noStroke(); rect(20, y - 20, 200, 30); }
// Pokemon name fill(0); textSize(13); text(pokemon.name, 30, y); }
// Show details if loaded if (selectedPokemon && selectedPokemon.types) { fill(0); textSize(14); text('Details for ' + selectedPokemon.name + ':', 280, 30);
let y = 70;
// Types fill(80); textSize(12); text('Types:', 290, y); y += 20; for (let i = 0; i < selectedPokemon.types.length; i++) { fill(120); textSize(11); text('- ' + selectedPokemon.types[i].type.name, 300, y); y += 18; }
y += 10;
// Stats fill(80); textSize(12); text('Base Stats:', 290, y); y += 20; for (let i = 0; i < min(4, selectedPokemon.stats.length); i++) { let stat = selectedPokemon.stats[i]; fill(120); textSize(11); text(stat.stat.name + ': ' + stat.base_stat, 300, y); y += 18; } }}
function mousePressed() { if (!pokemonList) return;
let results = pokemonList.results; for (let i = 0; i < results.length; i++) { let y = 60 + i * 35; if (mouseX > 20 && mouseX < 220 && mouseY > y - 20 && mouseY < y + 10) { let pokemon = results[i]; selectedPokemon = {name: pokemon.name};
// Load full details loadJSON(pokemon.url, (data) => { selectedPokemon = data; }); break; } }}This demonstrates REST’s resource nesting. First request gets /posts?_limit=5 (collection with parameter limiting results). Second request gets /posts/{id}/comments (nested resource). The URL structure expresses relationship. Comments belong to posts. But notice the dependency: we must first fetch posts to know their IDs before we can fetch their comments. REST’s statelessness means each request is independent, but our application logic must maintain state across requests. We must remember which post was selected. We must coordinate timing (wait for posts before fetching comments). The protocol is stateless but our code is not. We bear complexity of state management.
CORS: Protocol as Gatekeeping
Section titled “CORS: Protocol as Gatekeeping”Try loading data from arbitrary website in our sketch. Often, it fails with error: “Access to fetch at ‘URL’ has been blocked by CORS policy.” CORS (Cross-Origin Resource Sharing) is security feature in browsers preventing websites from requesting data from other domains without permission.
When we work locally with Live Server, our origin is http://localhost:5500 (or similar port). This is different from https://editor.p5js.org, which is why some APIs that work in the web editor might fail locally, or vice versa. Open our browser’s Console (F12) to see CORS errors. They look like: “Access to fetch at ‘https://example.com/api’ from origin ‘http://localhost:5500’ has been blocked by CORS policy: No ‘Access-Control-Allow-Origin’ header is present on the requested resource.”
CORS exists because browsers historically allowed any script to request any URL. Malicious sites could exploit this: we visit evil-scammer.com, which secretly requests ourbank.com (where we are logged in), stealing our data. CORS blocks this. Browsers send “preflight” requests asking servers “Can a script from evil-scammer.com request your data?” If server says no, browser blocks request.
For creative coding, CORS is frustrating. Many APIs work when we paste URL into browser address bar but fail from our local sketch. Reason: browser navigation (typing URL) is not same as script request (loadJSON). Typing URL we are user deliberately visiting site. JavaScript fetching URL we are script making programmatic request. Different security model. APIs must explicitly allow cross-origin requests by sending Access-Control-Allow-Origin header. Public APIs usually do this. Random websites usually do not.
Origin means protocol + domain + port. http://localhost:8000 is different origin from https://localhost:8000 (different protocol) or http://localhost:3000 (different port). Seems arbitrary? That is protocol. Precise rules determining permission.
CORS is protocol as gatekeeping. It determines which code can access which data based on origin. Browser mediates. We can open Developer Tools, see that data exists, even read it manually. But our sketch cannot access it programmatically because platform forbids. This is Bratton’s platform sovereignty: browser platform decides what our code can do, regardless of our intent.
Working APIs for use must have CORS enabled:
-
JSONPlaceholder (
jsonplaceholder.typicode.com) provides fake blog data for testing. Users, posts, comments, todos. Predictable structure, no rate limits, always available. -
Open-Meteo (
api.open-meteo.com) gives weather data globally with no API key required. Current conditions and forecasts. Clean JSON. -
Dog CEO (
dog.ceo/api) returns random dog images. Simple responses, instant visual feedback. -
USGS Earthquake API (
earthquake.usgs.gov/earthquakes/feed/v1.0/) provides real-time seismic data. GeoJSON format, multiple feeds by magnitude and timeframe. -
REST Countries (
restcountries.com/v3.1) offers geographic data for all countries. Rich nested JSON good for parsing practice. -
Kanye West Quotes (
api.kanye.rest) provides Kanye West quotes. Simple responses, instant visual feedback.
Part 3: Failure, Resistance, and Networked Practice
Section titled “Part 3: Failure, Resistance, and Networked Practice”When Networks Fail
Section titled “When Networks Fail”Networks always fail. Servers go down. Cables break. DNS stops resolving. Rate limits block requests. Our code must account for this. Error handling is not just technical practice but political act. When code breaks, who bears consequences?
Working in VSCodium with Live Server, we see failures immediately in our browser’s Console (F12). Network errors appear as red text. CORS blocks show specific messages about origins. Failed requests show in the Network tab with status codes (404, 500, etc.). This visibility helps us understand what actually broke versus what our code assumes will work.
p5.js lets us pass error callback as third argument to loadJSON():
[]loadJSON(path, [successCallback], [errorCallback])](https://p5js.org/reference/p5/loadJSON/)
let statusMessage = 'Loading data...';let data;
function preload() { loadJSON( 'https://jsonplaceholder.typicode.com/posts/1', successHandler, errorHandler );}
function setup() { createCanvas(500, 300);}
function draw() { background(240); fill(data ? color(0, 150, 0) : color(200, 0, 0)); textSize(16); textAlign(CENTER, CENTER); text(statusMessage, width/2, height/2 - 40);
if (data) { fill(0); textSize(13); text(data.title, width/2, height/2 + 20, width - 60); } else { fill(150); textSize(12); text('Sketch depends on infrastructure we do not control', width/2, height/2 + 20); }}
function successHandler(data) { data = data; statusMessage = 'Data loaded successfully';}
function errorHandler(err) { data = null; statusMessage = 'Failed to load: ' + err;}This handles both success and failure. When request succeeds, success callback runs with data. When request fails (network unavailable, server down, URL wrong, CORS blocked), error callback runs with error object. Our sketch must handle both states. Most tutorials only show success case. This is pedagogically irresponsible. It teaches students to write fragile code that breaks unpredictably.
Error handling reveals dependencies. If our sketch displays nothing when API fails, we have made explicit: this work requires remote service cooperation. The failure is not bug but feature. It makes visible the precarity of networked practice.
Timing and Rate Limits
Section titled “Timing and Rate Limits”APIs impose rate limits. Typically 100-1000 requests per hour. Exceed limit, get blocked. Sometimes temporarily (wait 15 minutes), sometimes permanently (banned). Rate limiting exists because servers cost money. Too many requests overwhelm server, increase costs, enable denial-of-service attacks. Rate limits protect server at expense of client convenience.
Never request in draw() loop. This sends request every frame. At 60fps, that is 3600 requests per minute, 216000 per hour. We will be blocked instantly. Instead, request once at start (preload), on user action (button click), or periodically:
let currentData;let lastUpdate;
function setup() { createCanvas(600, 400);
// Request every 30 seconds setInterval(makeRequest, 30000);
// Initial request makeRequest();}
function draw() { background(240);
if (currentData) { fill(0); textSize(14); textAlign(CENTER);
if (currentData.type === 'single') { text(currentData.joke, 50, 150, 500, 100); } else { text(currentData.setup, 50, 130, 500, 80); fill(100); text(currentData.delivery, 50, 200, 500, 80); }
if (lastUpdate) { fill(150); textSize(12); let elapsed = (Date.now() - lastUpdate) / 1000; text('Updated ' + elapsed.toFixed(0) + 's ago', width/2, 300); text('Next auto-update in ' + (30 - elapsed).toFixed(0) + 's', width/2, 320);
fill(100); textSize(11); text('Press SPACE to force update (tests rate limit)', width/2, 360); } }}
function makeRequest() { loadJSON('https://v2.jokeapi.dev/joke/Any?type=single,twopart', onDataReceived, onDataFailed);}
function onDataReceived(data) { currentData = data; lastUpdate = new Date();}
function onDataFailed() { console.log('Request failed - possibly rate limited');}
function keyPressed() { if (key === ' ') { makeRequest(); }}This requests once immediately, then every 30 seconds. The sketch displays how long since last update, making timing visible. Rate limits are protocol constraint. We must respect them or be excluded. This is control through scarcity. Server says: we may request this often, no more. We comply or lose access.
When testing locally with Live Server, we can watch requests happen in real-time in our browser’s Network tab. Each request appears with timestamp, response time, status code. This visibility helps us understand timing as material constraint rather than abstract concept. Our sketch runs locally, but depends on remote resources responding within acceptable timeframe. The protocol mediates this dependency.
Early Protocols and Institutional Practice
Section titled “Early Protocols and Institutional Practice”Shu Lea Cheang created “BRANDON” (1998-1999), first web artwork commissioned by Guggenheim Museum. This year-long web project about Brandon Teena, transgender man murdered in hate crime (1993), examined how identity constructs in networked space. BRANDON used emerging web protocols: VRML for 3D spaces, streaming video, database-driven content, remote webcam feeds. The project asked: if identity becomes data transmitted through protocols, what violence occurs when protocols fail to accommodate trans existence?
Forms requiring binary gender input, databases with unchangeable name fields, protocols assuming stable identity - these infrastructural choices enact epistemic violence. Every form that makes us choose M or F is protocol enforcing particular ontology. Every database schema requiring “legal name” is protocol privileging state authority over self-determination. Protocols are not neutral containers. They are designed for particular subjects, particular uses, particular worlds. When we do not fit, protocol breaks or breaks us.
BRANDON established protocols for web-based institutional art. How does museum collect work that is live, networked, changing? How do we archive work whose content is user-generated, distributed across servers, dependent on technologies that become obsolete? The work itself is protocol specification for institutional engagement with networked practice. Guggenheim had to negotiate: what does acquisition mean when work has no object? What does preservation mean when work depends on platforms that will disappear? These questions remain urgent. Museums still struggle with networked art because traditional protocols (acquire object, conserve object, display object) do not transfer.
Her recent “3x3x6” (2019) at Venice Biennale’s Taiwan Pavilion placed surveillance equipment and facial recognition systems in former Palazzo delle Prigioni prison, where political prisoners were once held. The title references cell dimensions (3x3 metres) monitored by 6 cameras. Historical architecture of confinement merges with contemporary protocol of surveillance. Both use architectural constraint to control bodies. Protocol is panopticon: we do not know whether server is watching, so we behave as if always observed. CCTV cameras, whether active or not, modify behaviour. APIs, whether logging or not, modify practice. We cannot know what is recorded, how it will be used, who will access it. This uncertainty is control mechanism.
Synthesis: Control Through Protocol
Section titled “Synthesis: Control Through Protocol”Galloway opened this week with a paradox: how does control exist after decentralisation? Networks appear to distribute power, yet power persists. His answer: protocol. Technical standards determining how nodes communicate, what formats data takes, which interactions are possible. Protocol is immanent rather than transcendent, embedded rather than imposed, technical rather than political in appearance. But it governs nonetheless.
We have learned to request data from distant systems. Each request executes protocol: HTTP methods, REST conventions, JSON formats, CORS permissions. These protocols appear neutral, concerned only with interoperability and efficiency. But they encode politics. They determine who can speak, in what language, under what conditions. They standardise, and standardisation advantages those whose needs align with standard whilst marginalising those whose needs do not fit.
American Artist showed protocols that cannot accommodate. Database fields requiring first and last name fail when someone names themselves to critique the system. Surveillance protocols that hypervisibilise Black bodies whilst failing to recognise Black humanity. Their work demonstrates that protocols assume compliance, assume users fit expected patterns, assume world organised in particular ways. When we refuse, when we exploit ambiguities, when we provide technically valid but semantically empty data, protocol breaks. Not because of bug but because protocols cannot handle resistance they did not anticipate.
Mimi Ọnụọha revealed what protocols make unmeasurable. Missing datasets are missing by design. Police killings lack comprehensive database because no standardised reporting protocol exists. Tech companies collect vast data whilst keeping it proprietary. Protocol determines not just how data is collected but whether data is collected, whether data is made available, whether data is acknowledged to exist. What cannot be represented in standardised format effectively does not exist for computational systems. Her work makes visible the absences that protocols create, the lives they deem unmeasurable, the knowledge they exclude.
Creating our own datasets through Google Sheets and opensheet responds to these absences. We can collect what APIs ignore, structure it ourselves, make it accessible through protocol. But this is not liberation. We still depend on corporate infrastructure (Google’s servers), volunteer labour (opensheet maintainer), and protocol standards (HTTP, JSON) we did not design. The dependencies shift but do not disappear. What we gain is agency to decide what gets measured, even as we acknowledge the precarity of that agency.
Shu Lea Cheang established protocols for networked institutional art, showing how protocols govern not just technical communication but cultural practices, institutional relations, aesthetic possibilities. BRANDON asked what happens when identity becomes data transmitted through protocols designed for cisgender subjects. The work itself became protocol specification for museums engaging networked practice. Her surveillance work revealed that uncertainty about being watched is itself control mechanism. We modify behaviour because we cannot know what is logged, how it will be used, who will access it. Protocol creates panopticon without requiring constant surveillance.
What does this mean for creative practice? Networks are not neutral tools. They are political infrastructure embedding particular power relations, serving particular interests, enabling particular forms of life whilst constraining others. When we build network-based work, we enter into these relations. We depend on infrastructure shaped by history, speak languages designed by others, negotiate with systems that may refuse us.
The code we write fetches data from distant servers. Each request is supplication. Each response is negotiation. Each dependency is political relation. Protocol determines the terms. We can comply, knowing we comply. We can subvert, speaking protocol’s language whilst refusing its intent. We can refuse, accepting exclusion as price of refusal. Or we can propose alternative protocols that accommodate what dominant protocols exclude - though we must recognise that alternative protocols still depend on broader infrastructures, still speak inherited languages, still negotiate with existing power.
But we cannot pretend protocol is neutral. It is control. Distributed, embedded, technical in appearance, but control nonetheless. Understanding protocol means understanding contemporary power - how it operates through standards rather than commands, through architecture rather than authority, through what it makes impossible rather than what it explicitly forbids. Every API call participates in this. Every network request executes these relations. The question is whether we do so unconsciously or deliberately, invisibly or visibly, uncritically or with awareness of what we are doing.
Weekly Task: Your Data as API
Section titled “Weekly Task: Your Data as API”We have learned to request data from distant systems. Now let us question what it means to create data, to decide what gets measured, to make our observations accessible through protocol.
Create a dataset about something we observe, then visualise it.
Not data that already exists through APIs, but data we collect ourselves. Observations that APIs do not measure. Patterns we notice. Experiences we track. Things that should be data but are not.
This task has two parts that cannot be separated: collection and visualisation. The collection determines what becomes knowable. The visualisation determines what becomes visible. Both are intentional acts.
Part 1: Collect Data (One Week)
Section titled “Part 1: Collect Data (One Week)”Keep a Google Sheet for one week documenting something we observe, notice, feel, or encounter.
What to measure:
- Something intimate, local, specific to your experience
- Something APIs do not measure or cannot measure
- Patterns in daily life, places you’ve been to, music you listened to, food you ate, conversations you’ve had, environmental observations, emotional states, encounters with others, things that make you pause, anything you choose to notice
How to structure:
- First row: column headers (timestamp, location, observation, food, music, mood, weather, or whatever categories make sense for what you are measuring)
- Each subsequent row: one observation
- Be consistent in structure, even if content varies
- Collect at least 15-20 observations across the week
This is not scientific data collection. We are not trying to be objective or comprehensive. We are choosing what to measure, how to categorise it, when to record it. These choices reveal what we value, what we notice, what we consider worth preserving.
Part 2: Using it as an API
Section titled “Part 2: Using it as an API”Use opensheet.elk.sh to turn your Google Sheet into JSON API:
- Share sheet publicly (File → Share → “Anyone with link can view”, set to Viewer)
- Copy sheet ID from URL (the long string between /d/ and /edit)
- Use URL format:
https://opensheet.elk.sh/SHEET_ID/SHEET_NAME
Now our personal observations exist as protocol-accessible data. Anyone can request them. They are structured, formatted, available for computational processing. What changed in this translation from private observation to public data?
Part 3: Best part: Make Something
Section titled “Part 3: Best part: Make Something”Create p5.js sketch in VSCodium that loads YOUR data and does something with it.
The work should reveal something about the data, about the act of collecting it, about what becomes visible when personal observation becomes structured dataset.
Note: This is not a data visualisation course. You can make:
-
Abstract compositions where your data drives colour, form, motion
-
A dashboard or interface for exploring your observations
-
A map (temporal, spatial, emotional, conceptual)
-
Generative text or poetry derived from your observations
-
An interactive system that responds to patterns in your data
-
Something that makes the act of measuring visible
-
Something that questions what measuring does
-
Anything that uses your data as material
-
Make visible what you chose to measure, or make visible the measuring itself, or make visible the dependencies
-
Could be poetic, critical, playful, analytical, abstract, representational, anything
Technical requirements:
- Work in VSCodium, not p5.js web editor
- Create folder:
week-9-data-apior similar - Use
loadJSON()with your opensheet URL inpreload()or with callbacks - Handle errors gracefully (show what happens if network fails, if sheet becomes unavailable, if data structure changes)
- Test with Live Server, use Developer Tools (F12) to watch network requests
- Do not request in
draw()loop
Some Directions (Not Requirements)
Section titled “Some Directions (Not Requirements)”You might:
- Map temporal patterns (observations across time)
- Compare different observation types or moods
- Show absence (days when you did not record anything)
- Show the act of measuring itself (timestamps, locations as geographic/temporal map)
- Make failure part of the work (what if sheet disappears? what if opensheet stops working?)
- Combine your data with external API (your observations + weather data, earthquake data, etc.)
- Create live updating work (if you keep adding to sheet)
- Question the categories you created (why these column headers? what do they assume? what do they exclude?)
Additional APIs (Optional)
Section titled “Additional APIs (Optional)”You can combine your personal data with other APIs to create relationships, comparisons, or context. Some possibilities:
For more APIs, see Awesome Public APIs on GitHub (check that they support CORS and do not require authentication unless you want to deal with that).
You might use external APIs to:
- Compare your observations with objective measurements (your mood vs actual weather)
- Add context from elsewhere (earthquakes happening while you felt anxious)
- Create unexpected juxtapositions (your daily observations + random facts)
- Question what gets measured officially vs what you chose to measure
- Show dependencies (your work requires multiple remote systems cooperating)
Questions to Sit With (not answer directly)
Section titled “Questions to Sit With (not answer directly)”On Data Collection:
Section titled “On Data Collection:”-
What did you choose to measure and why? What did you choose not to measure? What observations did you make but not record? What patterns did you notice only after seeing data accumulated?
-
Did measuring change what you noticed? Did knowing you would document something alter how you experienced it? Did the categories you created shape what you looked for?
-
What cannot be captured in spreadsheet format? What observations resist being put into cells? What relationships exist between observations that the grid cannot represent? What happens to temporal flow, to ambiguity, to things that exist between categories?
-
Whose data collection practices are you mimicking? Scientific observation? Corporate surveillance? Quantified self movement? Diary keeping? What assumptions come with each model?
On Protocol and Infrastructure:
Section titled “On Protocol and Infrastructure:”-
You are using Google’s servers, opensheet’s service, HTTP protocol, JSON format. Whose infrastructure? Whose labour maintains it? What happens when any link in this chain breaks?
-
Google can read your sheet. Google can delete it. Google complies with government data requests. opensheet logs your requests. What privacy did you give up for convenience? What surveillance did you opt into?
-
You made personal data publicly accessible through API. Anyone can now request it, process it, use it. Why did you do this? What changes when private observation becomes public data? Should all information be freely accessible?
-
What if you wanted to make data accessible only to specific people? Only under certain conditions? What if you wanted to revoke access later? Can you? Protocol assumes openness is good. Is it?
On Representation and Making:
Section titled “On Representation and Making:”-
Your work makes certain aspects visible whilst hiding others. Which aspects? Why those? What does your encoding prioritise? What does it marginalise?
-
You translated observations into numbers, categories, timestamps. Then translated those into colours, positions, sizes, behaviours, forms. What was lost in each translation? What was gained? What violence occurs in these reductions?
-
Who is your work for? Who can read it? Who is excluded by your visual language? Did you make it accessible? Did you want to? Are there things that should not be made easily legible?
-
Does your work fetishise data? Does it suggest that quantification makes things more real, more valid, more important? Or does it question this? How?
On Missing Datasets and Politics of Measurement:
Section titled “On Missing Datasets and Politics of Measurement:”-
Mimi Ọnụọha asks: what datasets are missing? What did you measure that others ignore? What do official data sources not care about? What cannot be measured because no standardised protocol exists?
-
Could your dataset be aggregated with others measuring similar things? Should it be? What becomes possible (or dangerous) when individual observations combine into large datasets? Who benefits from aggregation? Who is harmed?
-
You created one week of data. Facebook, Google, Amazon create billions of datapoints about billions of people continuously. What is the difference between your dataset and theirs? Is it just scale? Or is there something fundamentally different about self-collected, consensual data versus extracted, surveilled data?
-
What labour did data collection require? Your labour of noticing, documenting, categorising. Whose labour maintains infrastructure that makes it accessible? Is this labour visible? Is it valued? Is it compensated?
On Control and Protocol:
Section titled “On Control and Protocol:”-
You requested data last week. This week you created data. Did this change the power relation? You still depend on Google, on opensheet, on HTTP, on JSON, on browser platform, on network infrastructure. Did you gain autonomy or just shift dependencies?
-
You spoke protocol’s language: made spreadsheet with proper structure, shared it correctly, used right URL format, received valid JSON. You complied with protocol. What if you did not want to comply? What if your observations do not fit protocol’s expectations? What if you wanted to refuse?
-
American Artist refused by providing technically valid but meaningless data to Facebook. Can you refuse whilst still using protocol? Can you subvert whilst complying? What would that look like?
-
Galloway argues protocol is control after decentralisation. Did you experience this? How does protocol constrain whilst appearing to enable? How does standardisation advantage some uses whilst excluding others?
See you all next week.